360 Degree Feedback
A new tab for ‘Analytics’ has now been introduced on 360View.
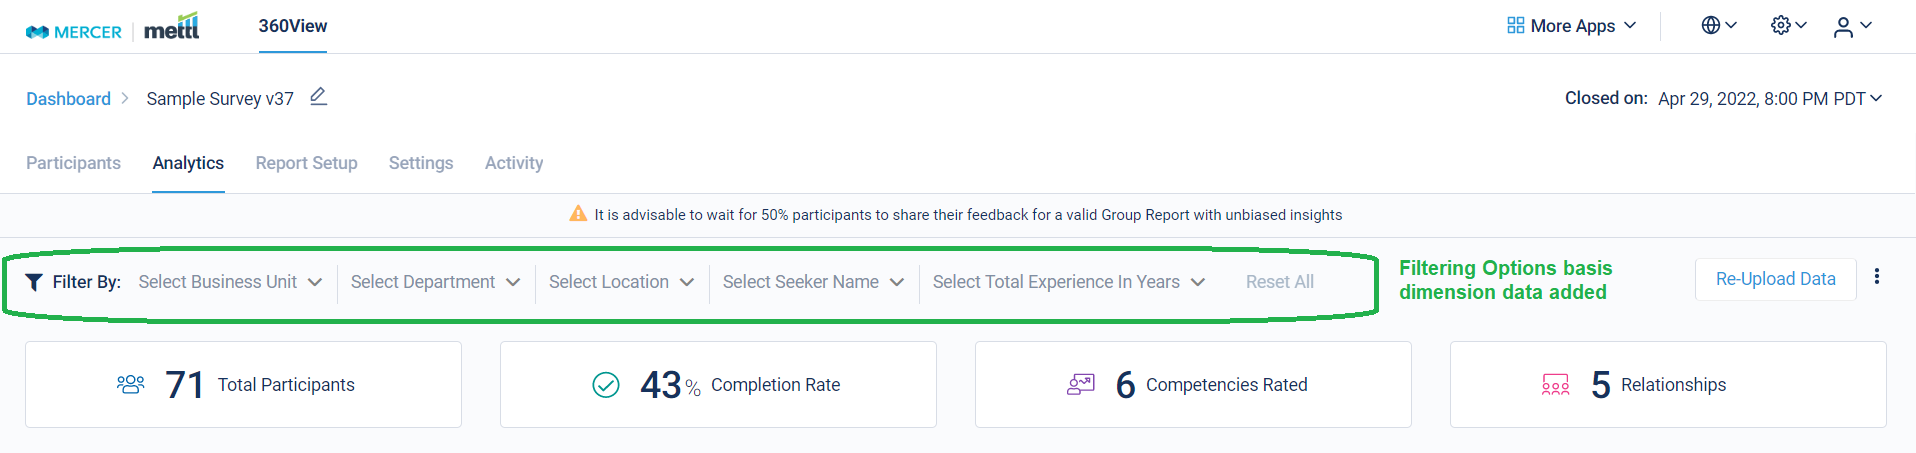
For every survey, after the survey admin provides more data for each Feedback Seeker (also known as dimensions), we show various analysis basis this dimensional data shared. Dimensions such as Location, Experience Range, Department, Business Unit, Band Level etc. can be added for Group Analytics Dashboard.
On the basis of the dimensional data added for each Feedback Seeker, filters are provided (as highlighted in green in the screenshot below) that can be used for slicing and dicing of data. This helps in seeing the Group Reports data on various cuts for better understanding of the survey output.
We will be rolling out the complete support for Group Reports in multiple phases. As part of Phase 1, the below Dashboard has been added.
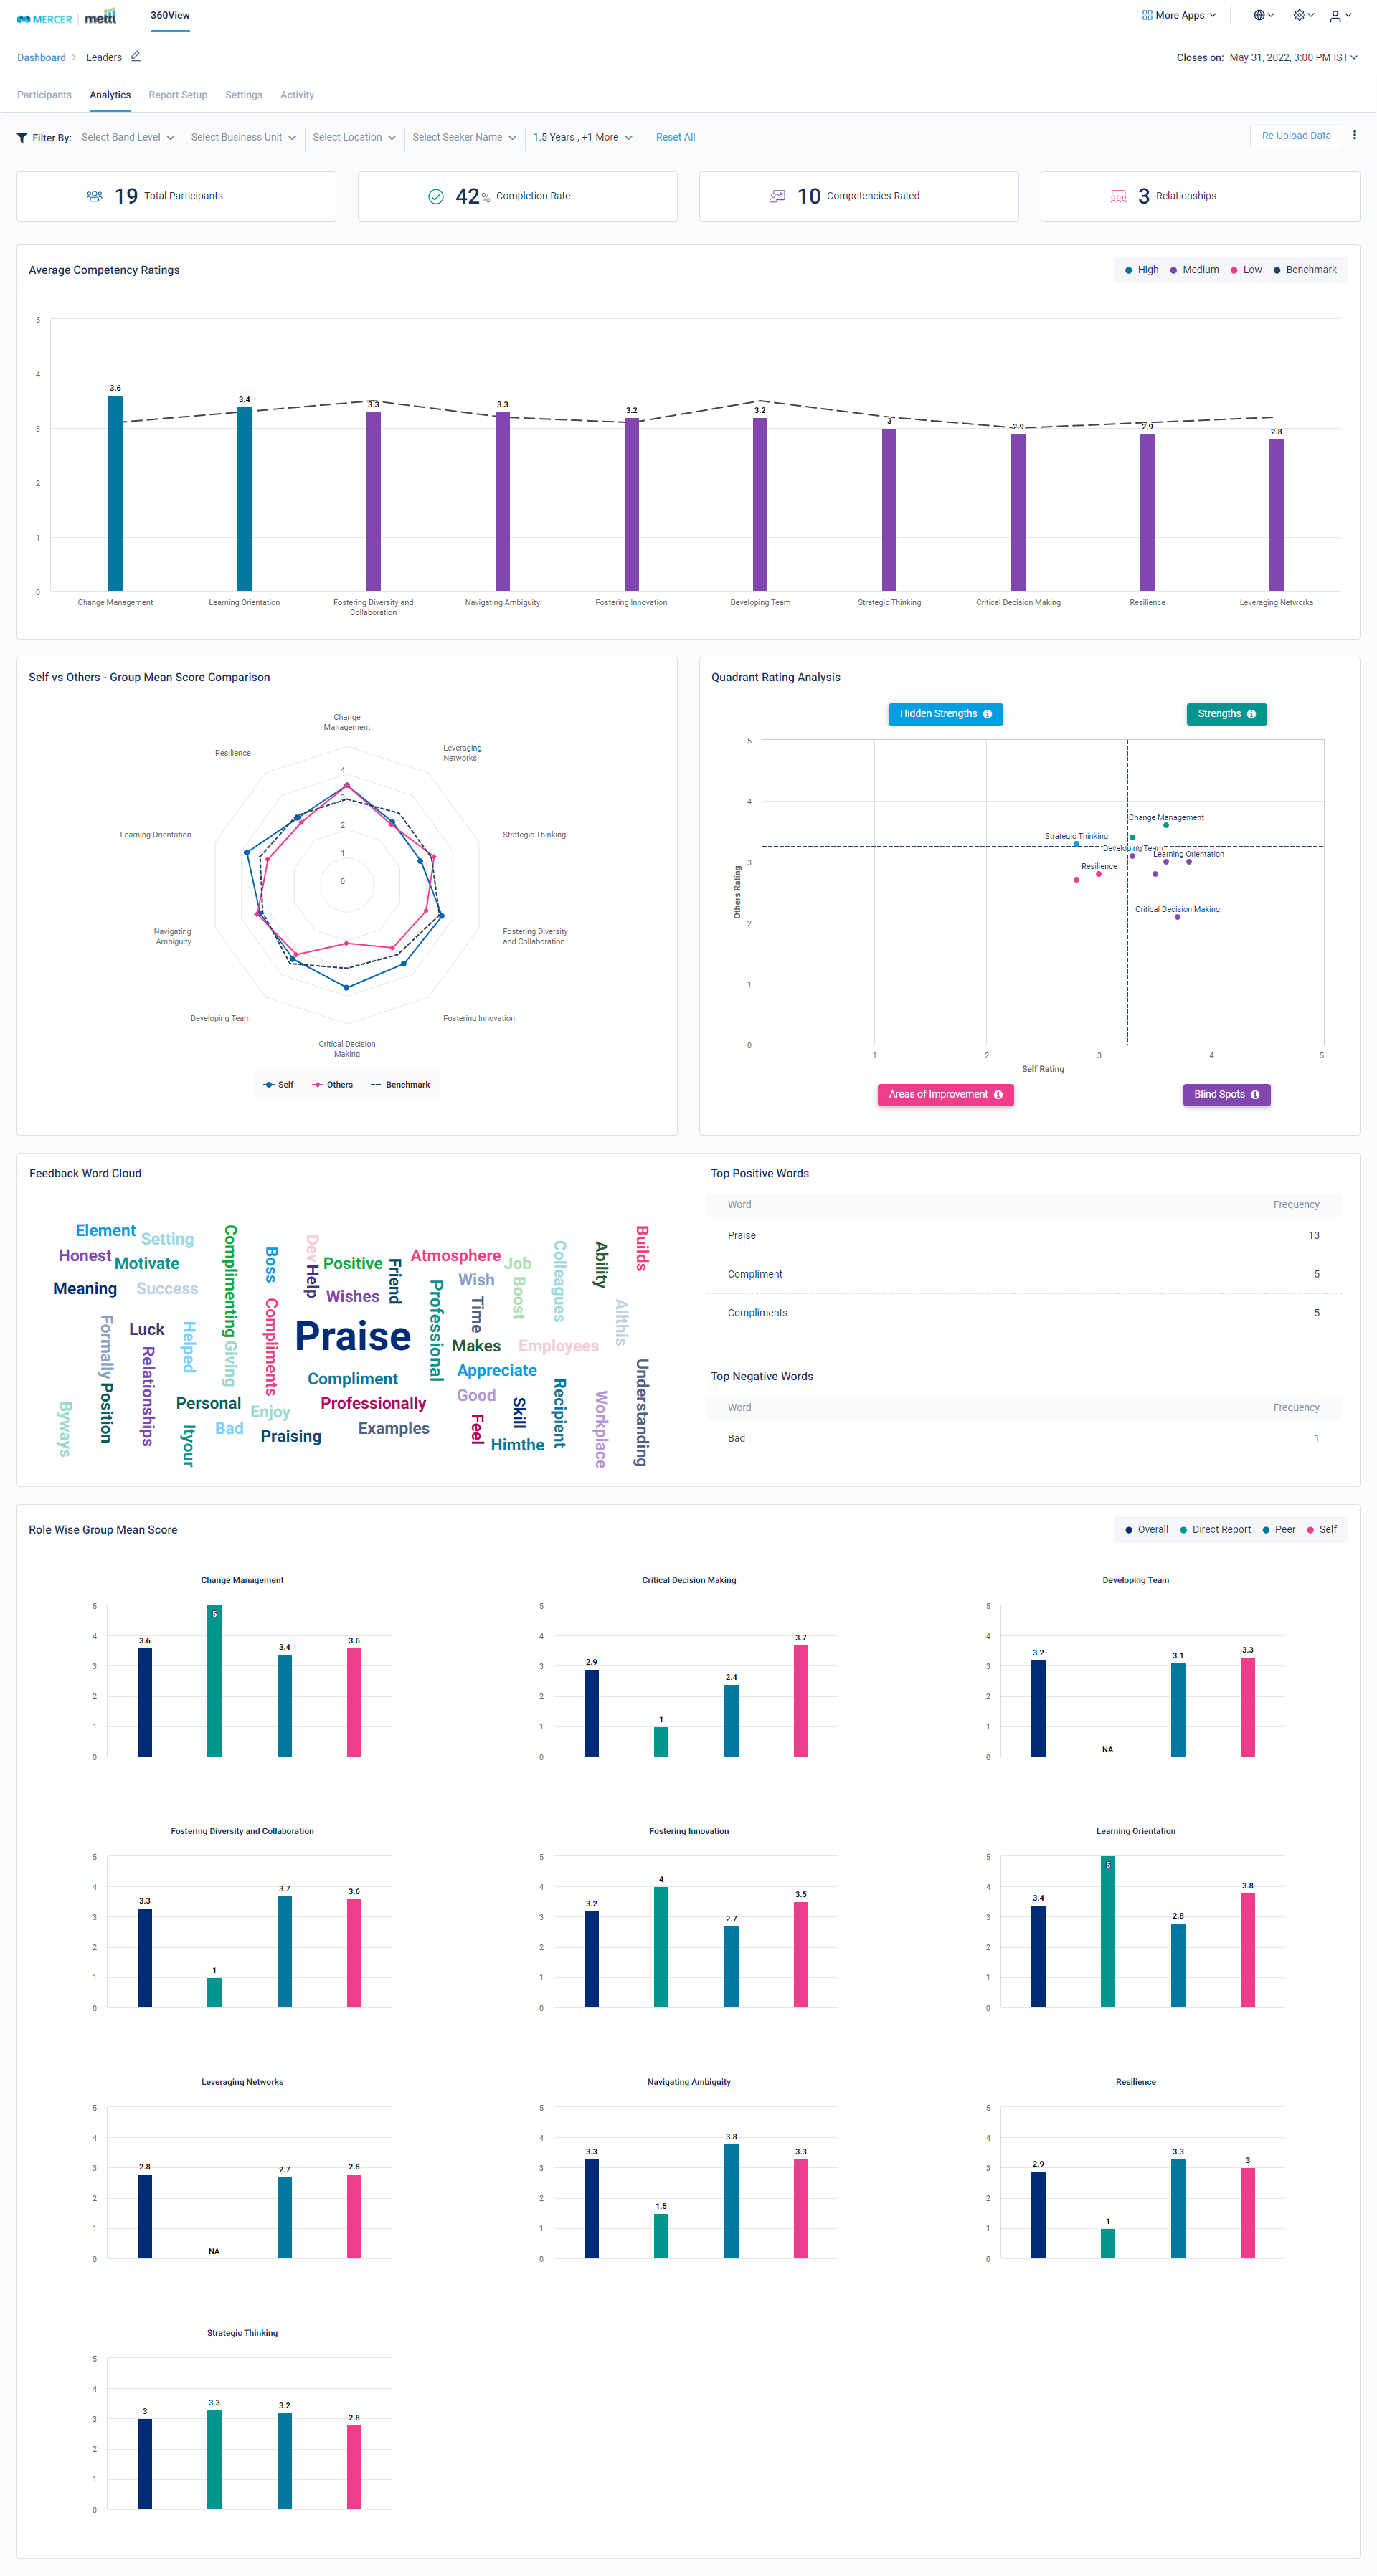
Let’s breakdown each section of the Dashboard for a better understanding. The below highlighted ‘Filter’ options appear automatically on the basis of the uploaded data for Seeker’s Dimensions. All the data shown on this Dashboard can be sliced and diced using these filter options.
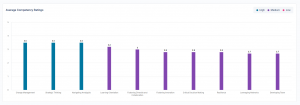
This graph gives a summary of average ratings received for each competency in the survey. The are in ascending order of the Ratings received for the survey. Highest rated competencies appear on the left and the lowest rated ones appear towards the right.
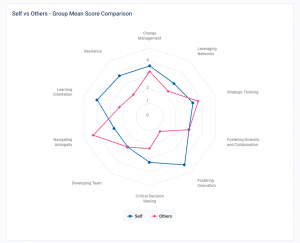
The below Spider Chart represents how the ratings appear in comparison between Self and all Other relationships that were a part of the survey.
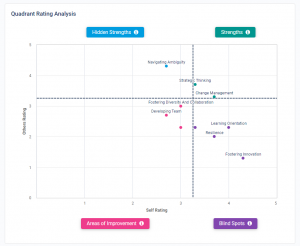
On the basis of the Spiderchart shown above, a comparison between the ratings received by Self vs Others is plotted on a graph. This highlights which competency can be classified as Strengths, Areas of Improvement, Hidden Strengths and Blind Spots for the entire list of Feedback Seekers in the survey.
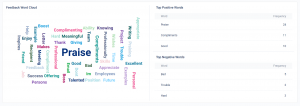
Basis the response received in the Open-ended Feedback questions, we create a word cloud to highlight which words were used the most for sharing feedback for the Feedback Seeker. The Top Positive words and Top Negative words are also shown to understand the underlying sentiment shared in the Open-ended Feedback questions.
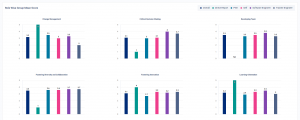
These bar graphs below give a detailed analysis of the average ratings received for each competency in the survey. This is classified by each relationship that was a part of this survey. This further helps in identifying relationship based patterns in the ratings received.
To add this additional data for Seeker’s dimensions, go to this new tab for ‘Analytics’ on the survey running page.
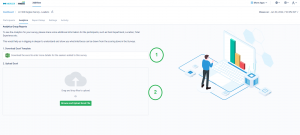
W.r.t. the markings 1 and 2 shown in the image above:
1 – Download the excel template for sharing the dimensions data using this option.
2 – Upload the excel template from here where the dimensions data has been filled in. Any error in the file would be highlighted in the respective cell with an error message. This helps you to quickly correct/standardize your data and upload it to be able to see the Dashboard.
What’s next: We will be rolling out Group reports in phases when we are able to plan this in a release.
Phase 2: Feedback Seekers would be required to share their own dimensions’ data basis which Group Analytics could be shown.
Phase 3: PDF Group Reports would be made available for each survey.
Phase 4: Customization options for PDF Group Reports would be provided.
Stay tuned for more amazing updates coming your way.
Enable Matrix-View of survey statements for Survey Participants
Matrix-View for candidate
New Intuitive, cleaner and refreshed reports UI
Feedback Seekers to initiate reminders to feedback providers
Introducing AI Summarizer in 360View [Beta]
Import Coding Questions during Live Sessions
Bulk PDF, Excel & Participant Status Download for Assessment Centre Events
Reminder emails based on completion percentage!
Entire participant journey’s email templates are now configurable!
Creating Cohorts for Effective Participant Management in Assessment Centres
My Tests Page: Advanced UI/UX with Folder-Based Test Organization
Web Plagiarism Detection Against Candidate Code
Bringing you closer to up-to-date skills and original content
Manage Settings for Interviews & Group Discussions
Email Management in Interviews & Group Discussions


 Behavioral Competencies
 Cognitive Competencies
 Coding Competencies
 Domain Competencies