Now, change Competency names and their order of appearing in the individual reports!
Previously, Competency names were shown as they were updated and there was no way of updating them. Also, these competencies appeared in alphabetical order in the reports.
But now, clients can rename competencies however and whenever they want to. Not just this, they can also change the order in which these Competencies appear in the reports. By default, competencies appear alphabetically in the reports.
Competency names are now editable in Report Setup, as shown below: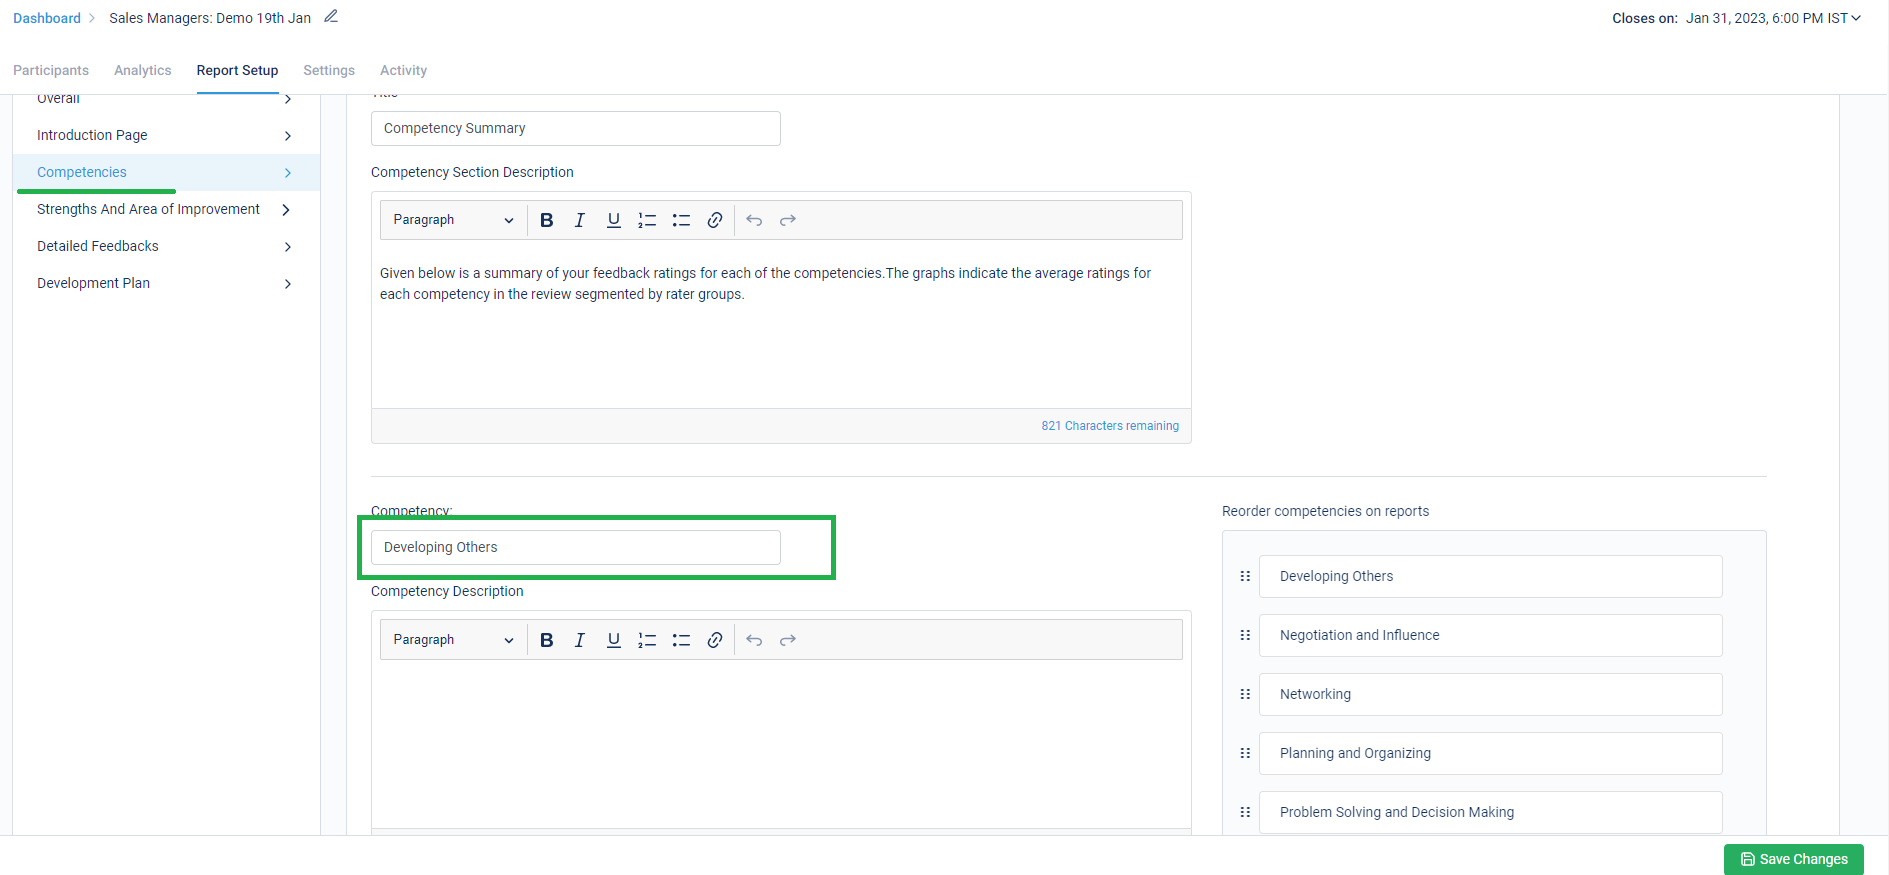
Competency order can also be modified from here: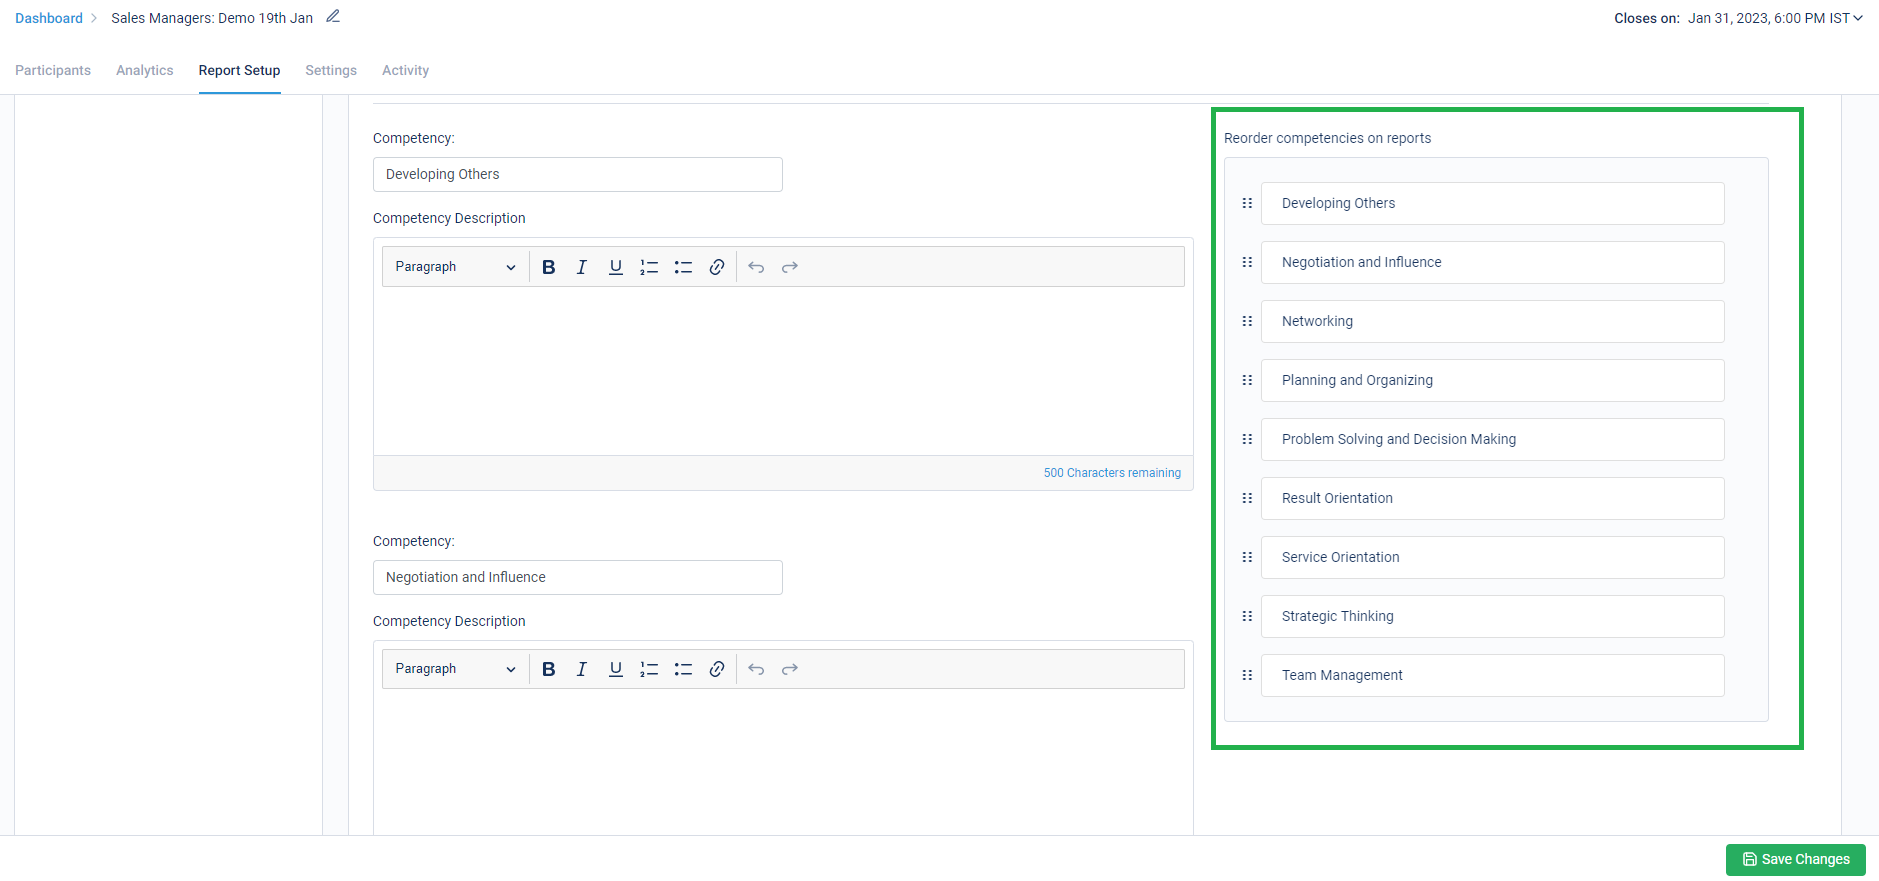
Stay tuned for more amazing updates coming your way.
Now, change Relationship names even after survey has been attempted by a participant!
Often our customers requested to update the relationship name between a Feedback Seeker and a Provider after the survey was attempted by the participants. This need often arose after the clients saw the real-time reports and wanted them to be more anonymous in nature or had any other finding that required the Relationship Names to be changed. Well, we heard you and delivered!
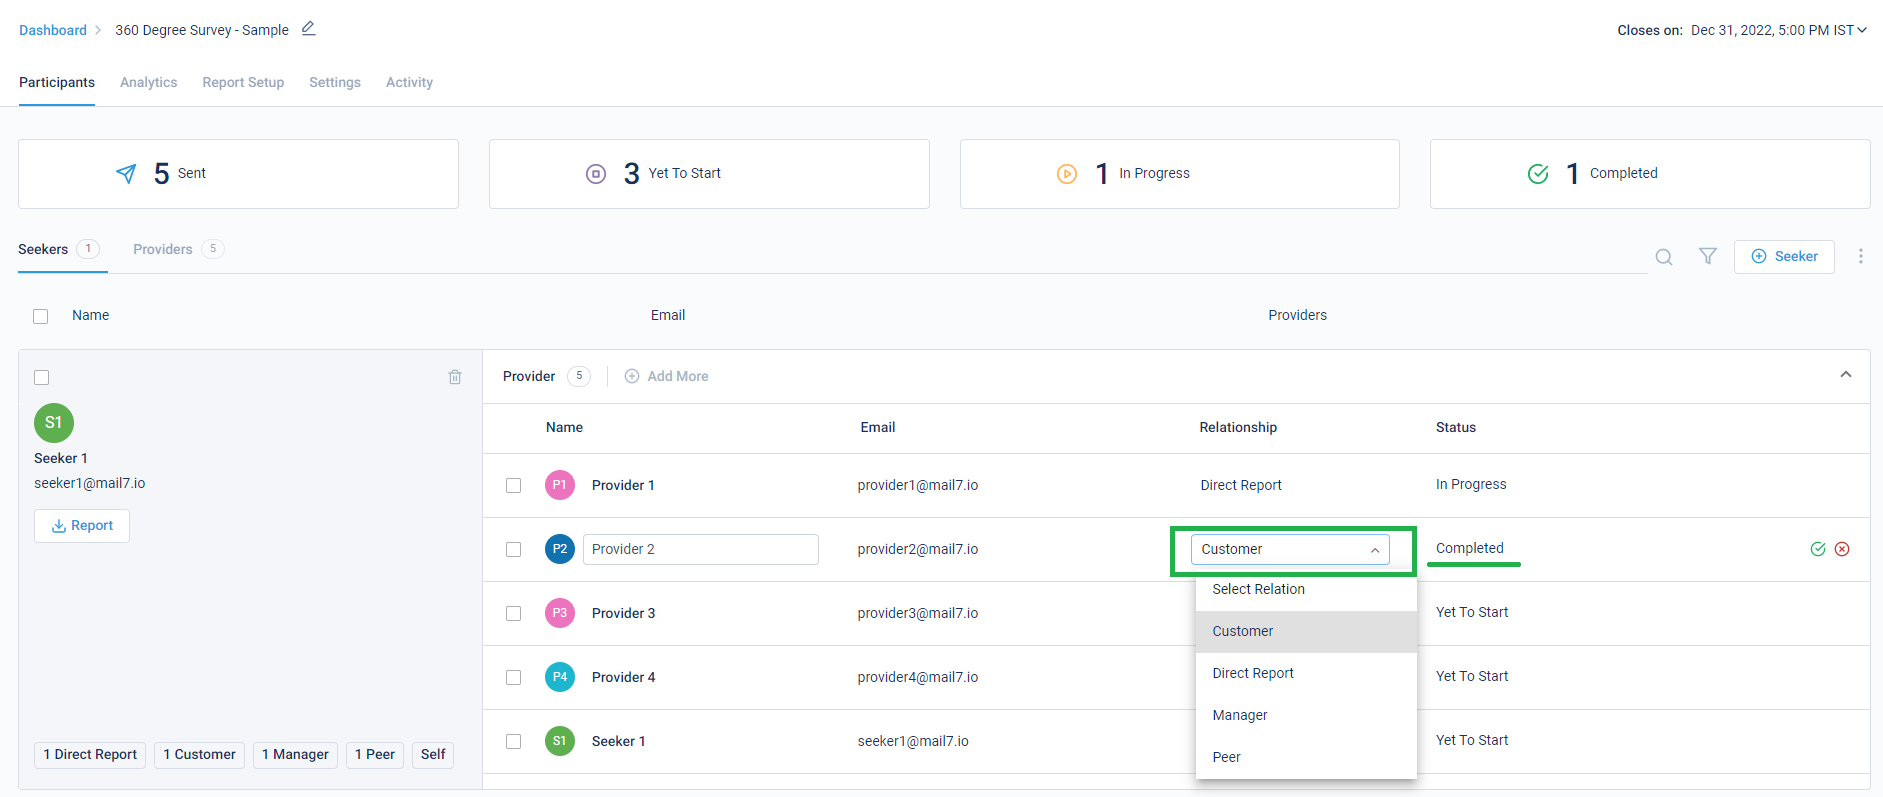
Below is where they can make these changes in a survey. This is as simple and reaching a participant’s details and editing them at any stage of the survey, even when the Survey has been completed.
Stay tuned for more amazing updates coming your way.
Now you can choose to show Feedback Seeker’s details on the survey window!
As Feedback Providers fill the survey for multiple Feedback Seekers, it becomes a little difficult for them to remember for whom they were filling the survey. Especially because the survey windows can remain open in the browser windows for up to certain number of days.
For improved clarity, we have now provided an option to show the Survey and Feedback Seeker’s details in the survey window. This helps with an improved understanding of whom the feedback is being provided for and the correct feedback is provided for each individual without confusing them as someone else.
In the assessment level setting, a string using the available fields can be used to create a custom survey name which can be shown in the survey window. This string can be modified as required:

The string created in this case is – ‘Survey Name’ for ‘Seeker Name’ – ‘Seeker EmailId‘- .This is how it will appear in the survey window:

Stay tuned for more amazing updates coming your way.
You can now choose to show custom instructions before the survey starts!
For any survey, any instruction to be shown for the entire survey was either incorporated in the invitation email, or was put in the first section’s instruction. Now, the custom instructions option available at assessment level can be used to show the survey level instructions. This helps to provide a dedicated space to show these custom instructions. We also take a confirmation from the participants also before proceeding further that they have read and understood the instructions clearly.
Below is how the setting appears for the assessment linked to the survey:

This is where the Custom Instruction is shown, right after a successful system compatibility check:

Stay tuned for more amazing updates coming your way.
Now, upload an image of your choice for it to reflect as report’s cover page image!
You can now choose to have a cover page image of their choice. Images above a suggested dimension can be uploaded for improved customization of 360View reports. This takes us one step closer to further brand the client reports. Reports appear more personalized and identify with the customer’s brand as well.
The setting for this can be accessed at survey level under ‘Report Setup’:

After clicking on the option above, User can select an image of their choice and edit the image with the various options available. Various customization options such as ‘Logo positioning’, ‘Text color’ and ‘Text positioning’ have also been made available now:

Post saving the changes, the image appears as the selected layout for cover page:

This is how the custom image would appear on the report’s cover page, making the customers experience the WOW moment for the reports:

Stay tuned for more amazing updates coming your way.
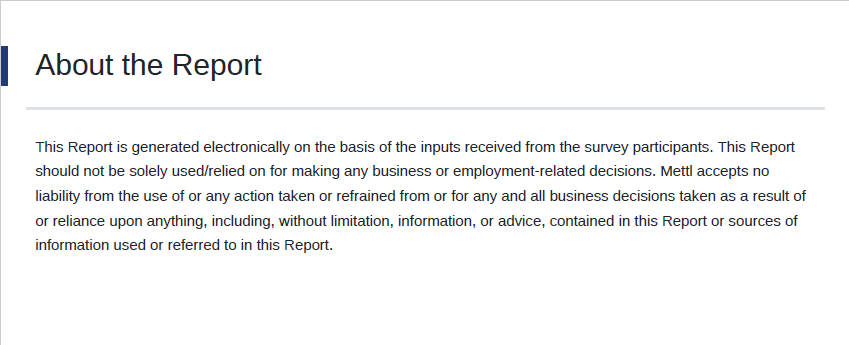
As part of legal compliance, we have added this mandatory section at the end of the individual reports. This will automatically appear in the language in which the report is generated.
Stay tuned for more amazing updates coming your way.
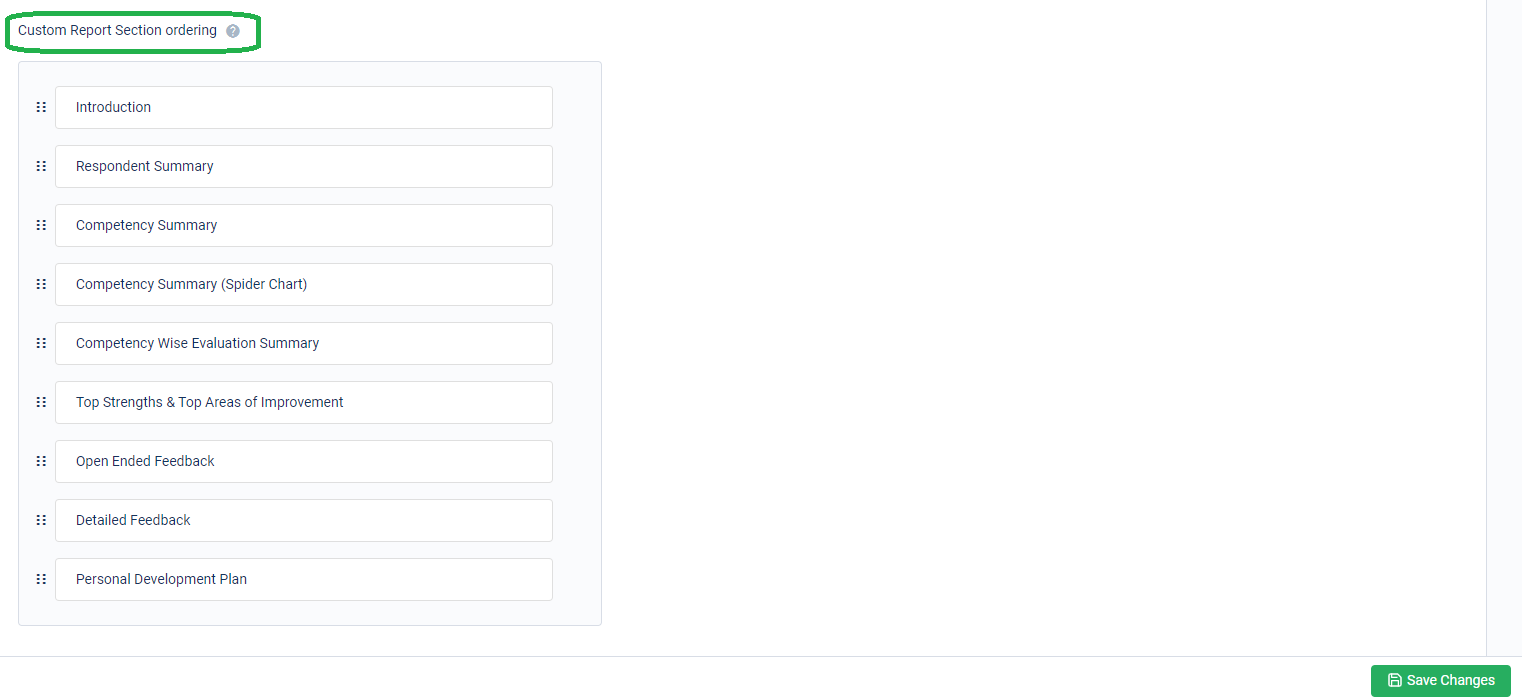
Now re-order the various sections of an Individual Reports!
For any survey, the admin can now re-arrange the sections of the report. This provides a greater flexibility to the clients to have certain information in a specific section appear before than the others.
Below is how the setting appears:
Stay tuned for more amazing updates coming your way.
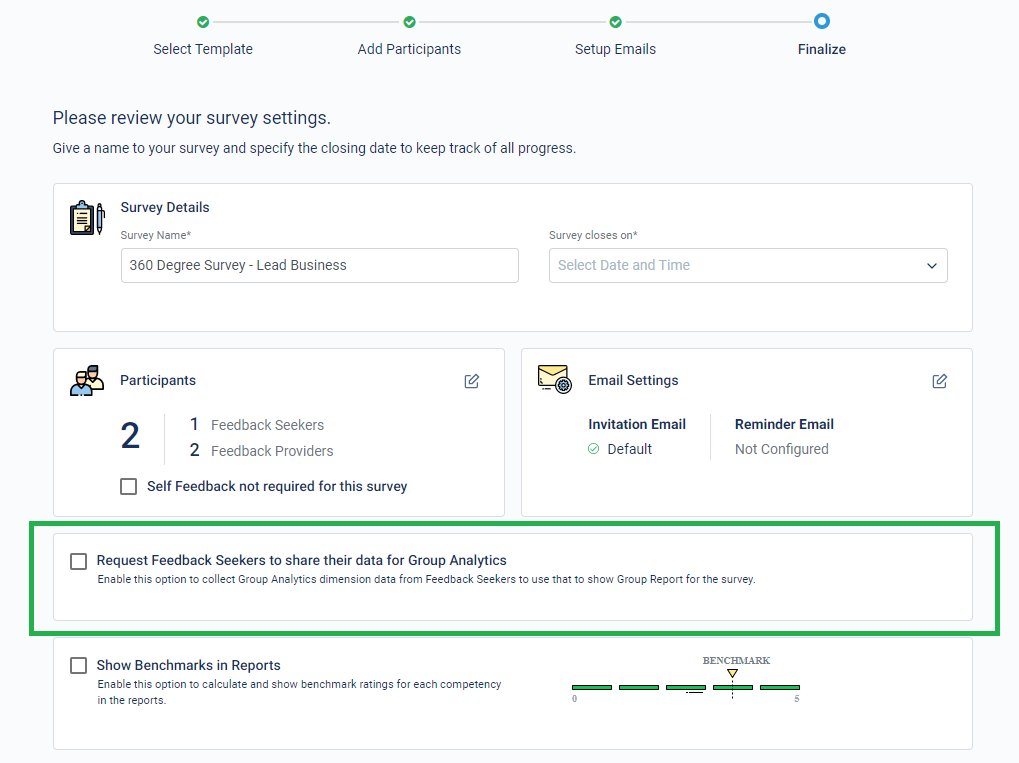
Now, request Feedback Seekers for their additional dimensional data for Group Analytics Dashboard!
Until now, survey admin was required to upload an excel with the additional data for all Feedback Seekers so that their Group Analytics dashboard could be created for any survey. However, as it is a tedious job for survey admins to collect and collate such enormous data, especially when surveys are of large scale.
Below are the details –
By using this setting on the Finalize step of survey creation, survey admins can define the additional data to be requested from the Feedback Seekers:
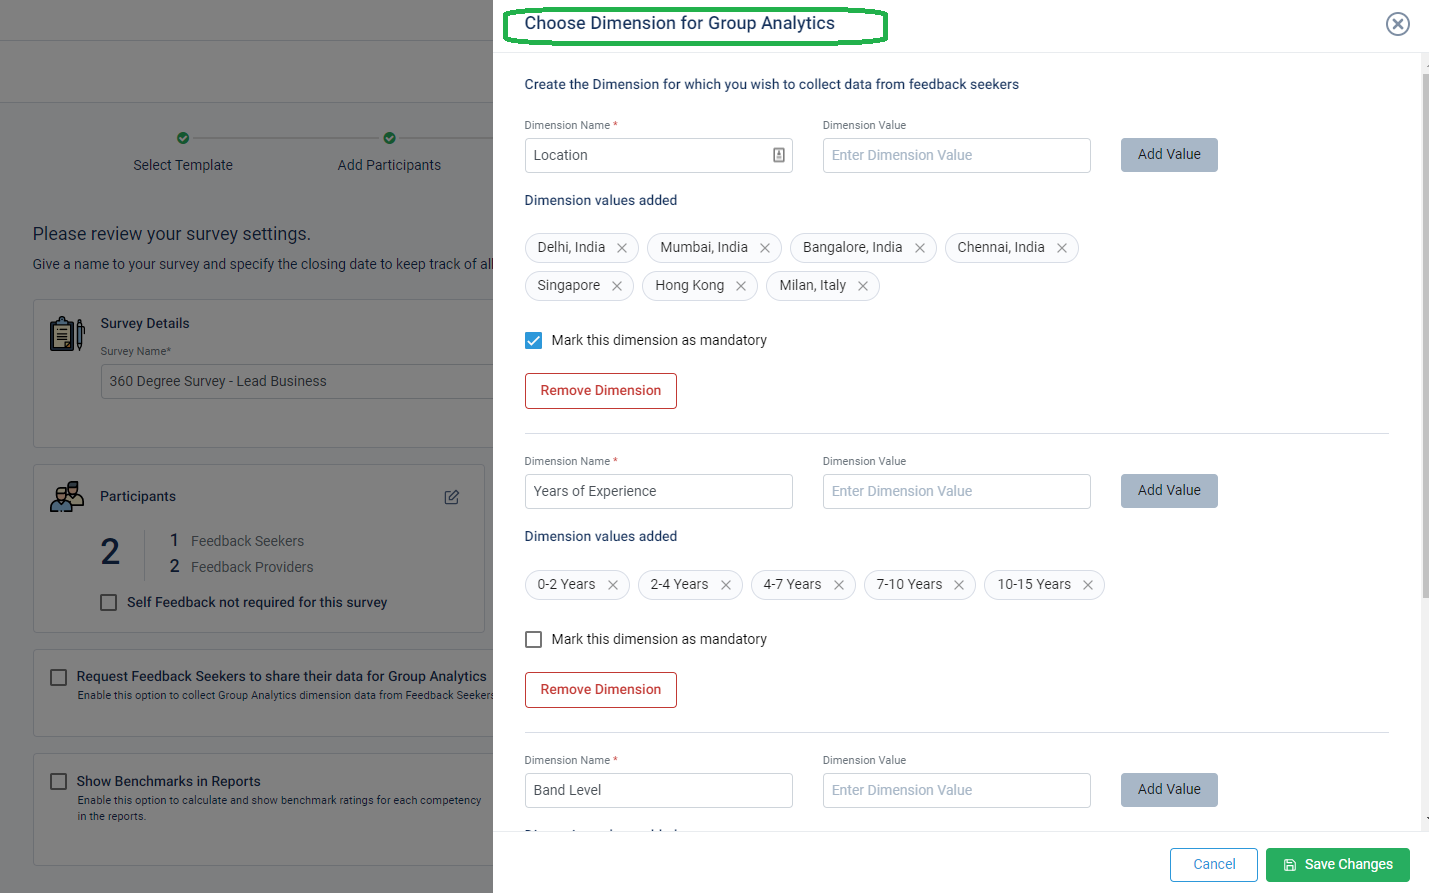
Here, the dimension names and the respective values are created for the Feedback Seekers to choose from:
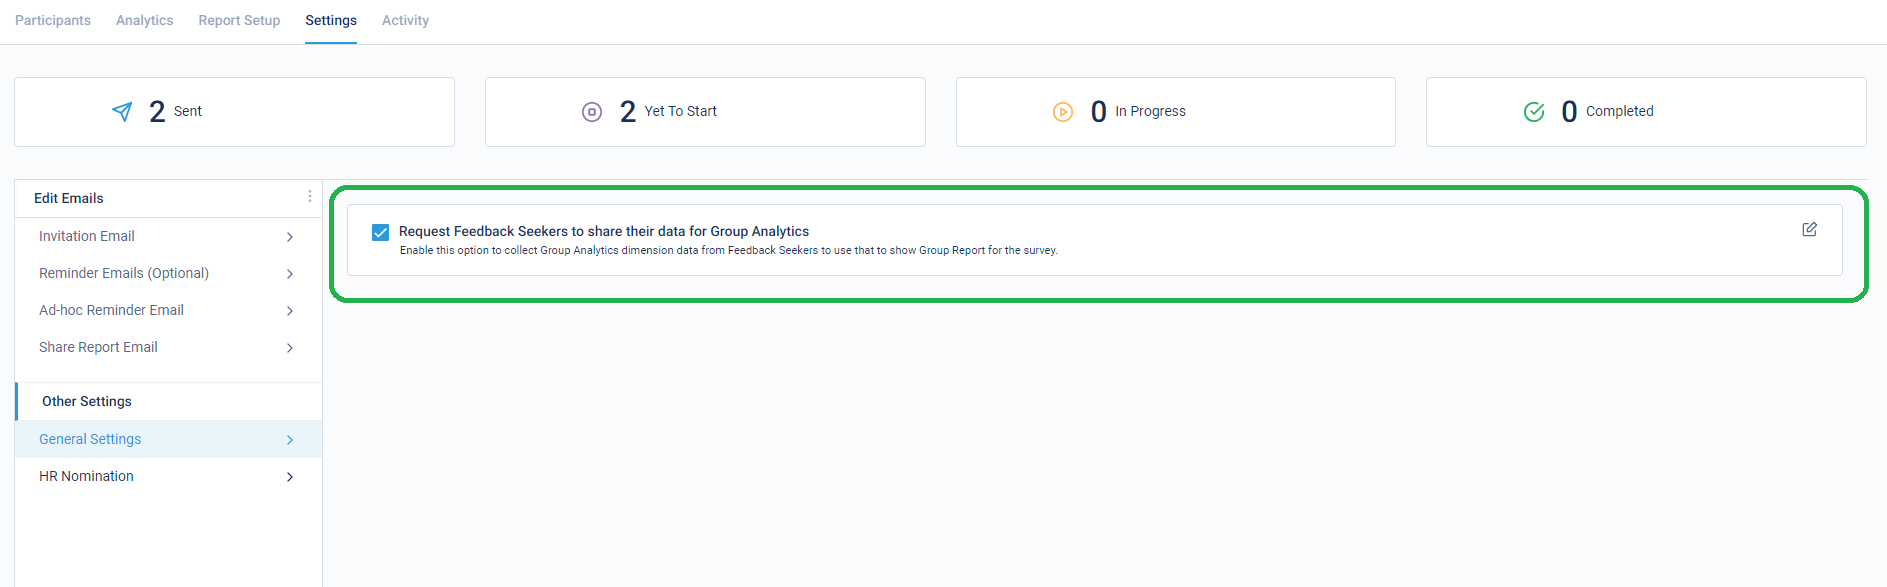
After the survey is launched, this setting can be enabled from here on the survey running page:
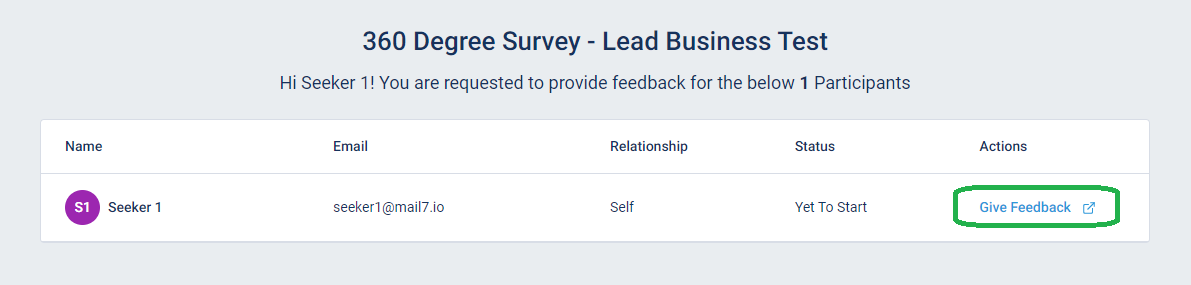
After the Feedback Seekers click on the below button for ‘Give Feedback’, we request them for the additional data:
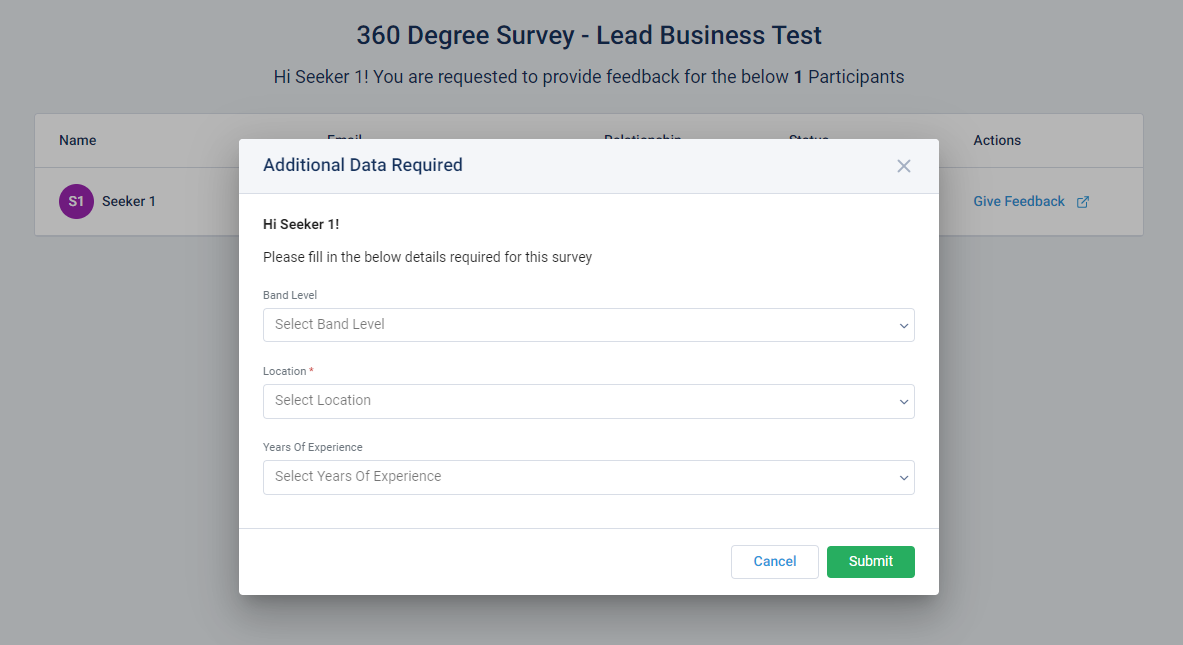
This is the pop-up with the field names and dropdown values shown on the basis of the configuration done by the survey admin:
Stay tuned for more amazing updates coming your way.
Now remove certain relationships (legends) from the Spider Chart!
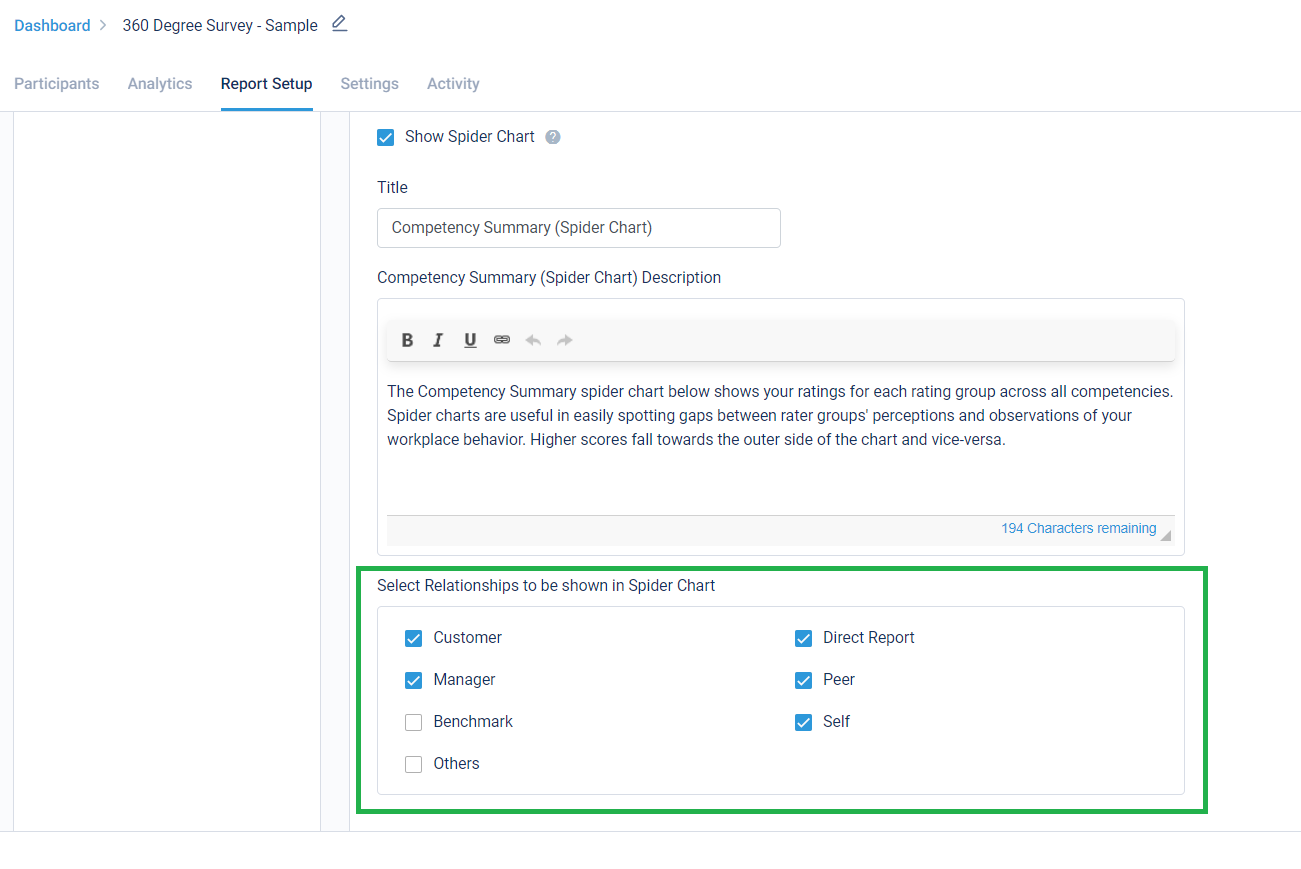
For any survey, the Spider Chart created for competency analysis always showed all the relationships that were part of the survey, along with the Self, Other & Benchmark. By using this new setting in Report Setup, certain legends can be removed from the Spider Chart. This was requested to us by Mercer consultants.
Below is a setting to enable this:
Stay tuned for more amazing updates coming your way.


 Behavioral Competencies
 Cognitive Competencies
 Coding Competencies
 Domain Competencies