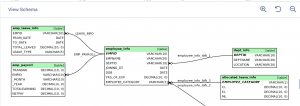
As part of our ongoing efforts to improve usability of our simulators, we are happy to let you know that we have enabled a zoom-in and zoom-out functionality in the View Schema tab of our database environment (DBLysis).
This update will help test-takers take reference from the most complex schema images with utmost ease.
In addition to this functionality, we have also improved the database schema generated in questions for a smoother test-taking experience.
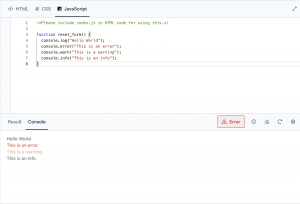
We are happy to inform that the console tab in our frontend coding environment now supports the use of console functions which enables front-end developers to debug their code.
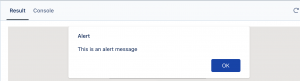
In addition to this update, we have solved for the usage of functions such as alert(), confirm() and prompt() without triggering browser tolerance for assessments where proctoring is enabled.
With this update, test-takers can easily use these functions and have a more seamless and comfortable test-taking experience.
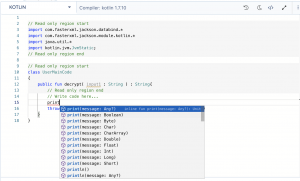
We are happy to announce that we have added support for version 1.7 of Kotlin on our general-purpose backend coding environment (CodeLysis).
This update comes with support for auto-complete and language support (IntelliSense) in Kotlin as well.
Clients will be able to select Kotlin 1.7 while creating or editing questions and test takers will be able to attempt coding questions in Kotlin 1.7 wherever available.
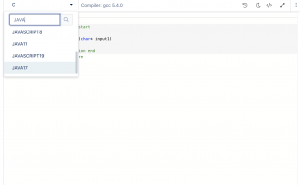
We are happy to announce that we have added support for the latest LTS (Long Term Support) version available for Java i.e., Java 17 on our general-purpose backend coding environment (CodeLysis).
This update comes with support for IntelliSense in Java 17 as well.
Clients will be able to select Java 17 while creating or editing questions and test-takers will be able to attempt coding questions in Java 17 wherever available.
We are excited to announce a much-awaited feature to view the console output for “Run Test Cases” while creating project-based questions (I/O). This feature will allow access to logs and will further improve the overall debugging process involved in writing test cases while creating project-based questions questions.
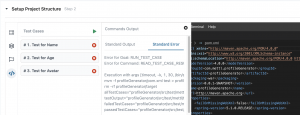
In case there are multiple command sets and/or prerequisite goals, output for each of them will be displayed separately.
Know more
To understand more about Mercer | Mettl’s project-based development environment, click here.
We are thrilled to share that we have revamped the UI and UX of our Front-end Simulator (FES). The improved UI provides test-takers with larger area for writing codes and viewing the output.
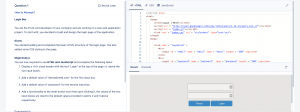
The new UX brings along a walkthrough, highlighting the key components of the interface and features like auto code complete and language support (IntelliSense) to assist test-takers in writing faster and efficient codes.
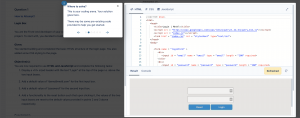
Hope you are as excited as us to let test-takers take a feel of the all-new interface of our front-end coding environment!
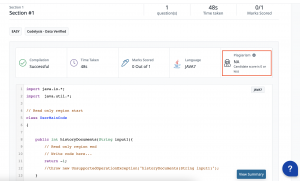
In continuation with our enhancements on our general purpose backend coding environment (CodeLysis) w.r.t Plagiarism calculation, we have added specific reasoning for test-takers whose plagiarism score is tagged as N/A.
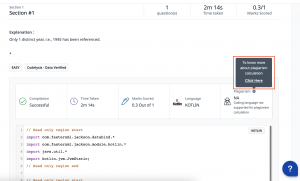
There are multiple reasons a test-taker’s plagiarism score can be tagged as N/A and hence, this enhancement will let users know the exact reason behind this particular tag.
Alongside this, accessing Mercer | Mettl’s documentation on Plagiarism calculation directly from the test-taker’s report is now just a click way.
Now you can choose to show Feedback Seeker’s details on the survey window!
As Feedback Providers fill the survey for multiple Feedback Seekers, it becomes a little difficult for them to remember for whom they were filling the survey. Especially because the survey windows can remain open in the browser windows for up to certain number of days.
For improved clarity, we have now provided an option to show the Survey and Feedback Seeker’s details in the survey window. This helps with an improved understanding of whom the feedback is being provided for and the correct feedback is provided for each individual without confusing them as someone else.
In the assessment level setting, a string using the available fields can be used to create a custom survey name which can be shown in the survey window. This string can be modified as required:

The string created in this case is – ‘Survey Name’ for ‘Seeker Name’ – ‘Seeker EmailId‘- .This is how it will appear in the survey window:

Stay tuned for more amazing updates coming your way.
You can now choose to show custom instructions before the survey starts!
For any survey, any instruction to be shown for the entire survey was either incorporated in the invitation email, or was put in the first section’s instruction. Now, the custom instructions option available at assessment level can be used to show the survey level instructions. This helps to provide a dedicated space to show these custom instructions. We also take a confirmation from the participants also before proceeding further that they have read and understood the instructions clearly.
Below is how the setting appears for the assessment linked to the survey:

This is where the Custom Instruction is shown, right after a successful system compatibility check:

Stay tuned for more amazing updates coming your way.


 Behavioral Competencies
 Cognitive Competencies
 Coding Competencies
 Domain Competencies